Skittle-themed color schemes for R graphics with RSkittleBrewer!
Choosing the perfect set of colors for a plot is hard. But people have thought a lot about this problem, and there are solutions! If you’re an R user looking for publication-quality color schemes that are backed by lots of scientific research, check out RColorBrewer, or use the color schemes in ggplot2.
If, on the other hand, you’re looking for a color scheme that reminds you of a bag of Skittles, check out RSkittleBrewer. This is a tiny R package I wrote yesterday to generate vectors of valid R color names for certain Skittle flavors. You can also generate a vector of M&M colors, if (like me) you’re more into chocolate.
The code is on GitHub. Here’s how you use it:
library(devtools)
install_github('RSkittleBrewer', 'alyssafrazee')
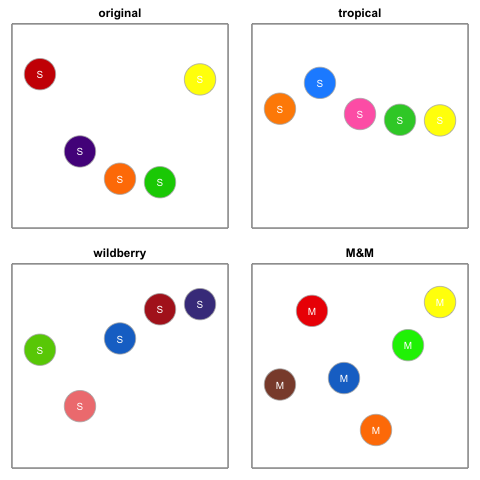
original = RSkittleBrewer('original')
tropical = RSkittleBrewer('tropical')
wildberry = RSkittleBrewer('wildberry')
mm = RSkittleBrewer('M&M')
And if you want to see how the colors actually look, you can make a plot:
plotSkittles()
It will look like this:
This work was inspired and supported by my mentors at Simply Statistics.
Enjoy making candy-themed R graphics!